Question:
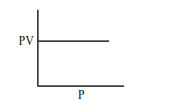
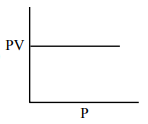
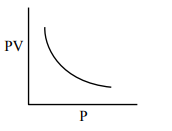
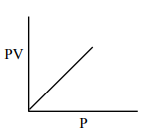
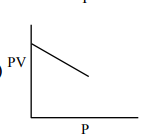
Which one of the following is the correct PV vs P plot at constant temperature for an ideal gas ? (P and $\mathrm{V}$ stand for pressure and volume of the gas respectively)
Correct Option: 1
Solution:
$\mathrm{PV}=\mathrm{nRT}(\mathrm{n}, \mathrm{T}$ constant $)$
$\mathrm{PV}=$ constant
