
Question:
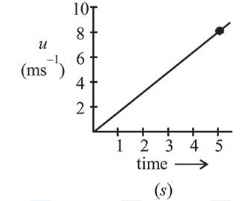
The speed verses time graph for a particle is shown in the figure. The distance travelled (in $\mathrm{m}$ ) by the particle during the time interval $t=0$ to $t=5 \mathrm{~s}$ will be_____________
Solution:
(20)
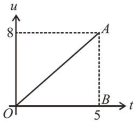
Distance travelled = Area of speed-time graph
$=\frac{1}{2} \times 5 \times 8=20 \mathrm{~m}$
Click here to get exam-ready with eSaral
For making your preparation journey smoother of JEE, NEET and Class 8 to 10, grab our app now.