
Question.
The speed-time graph for a car is shown in figure below.
(a) Shade the area on the graph that represents the distance travelled by the car during the first 4 seconds.
(b) Which part of the graph represents uniform motion of the car ?
The speed-time graph for a car is shown in figure below.
(a) Shade the area on the graph that represents the distance travelled by the car during the first 4 seconds.
(b) Which part of the graph represents uniform motion of the car ?
Solution:
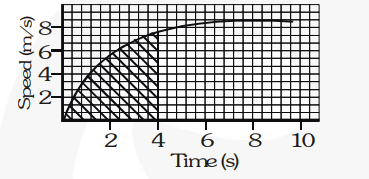
(a)During first 4 seconds, car is moving with non-uniform acceleration. Area of shaded portion represents distance travelled.
(b)The straight line portion of the graph represents uniform motion of the car.
(a)During first 4 seconds, car is moving with non-uniform acceleration. Area of shaded portion represents distance travelled.
(b)The straight line portion of the graph represents uniform motion of the car.