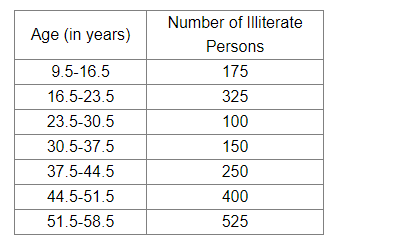
The following table shows the number of illiterate persons in the age group (10−58 years) in. a town:

The following table shows the number of illiterate persons in the age group (10−58 years) in. a town:

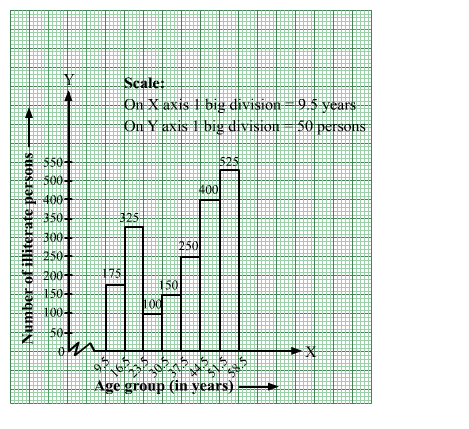
Draw a histogram to represent the above data.
The given frequency distribution is inclusive form.
So, we will convert it into exclusive form, as shown below:
We will mark the age groups (in years) along the x-axis & frequencies (number of illiterate persons) along the y-axis.
The scale is as follows:
On x-axis: 1 big division = 7 years
On y-axis: 1 big division = 50 persons
Because the scale on the x-axis starts at 9.5, a kink, i.e., a break, is indicated near the origin to signify that the graph is drawn with a scale beginning at 9.5
and not at the origin.
We will construct rectangles with class intervals (age) as bases and the corresponding frequencies (number of illiterate persons) as
heights.
Thus, we obtain the histogram, as shown below: