
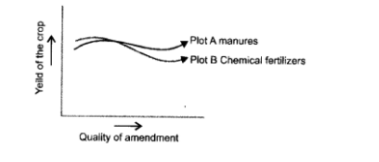
The figure shows two crop fields (plots A and B) have been treated by manures and chemical fertilizers respectively, keeping other environmental factors same.
Observe the graph and answer the following questions:
1. Why does plot B show sudden increase and then gradual decrease in yield?
2. Why is the highest peak in plot A graph slightly delayed?
3. What is the reason for the different pattern of the two graphs.
1. Sudden Increase: Chemical fertilizer supplies the minerals immediately in good quantity. Gradual Decrease. It is due to depletion of nutrients caused by absorption by plants, leaching to lower layers of the soil and killing of decomposer microbes.
2. Manures decay slowly so that release of minerals is also delayed. Manures take time to mix up with the soil and form crumbs, that increase water holding and aeration of the soil.
3. The difference in the two graphs indicates that manuring the soil is more beneficial than the use of chemical fertilizers. Rather, use of chemical fertilizers is harmful in the longer run.