Question:
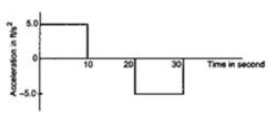
The acceleration of a cart started at t=0, varies with time as shown in the given figure. Find the distance travelled in 30 seconds and draw the position-time graph.

Solution:

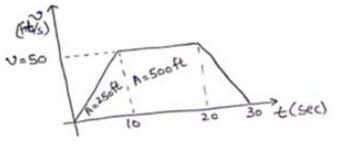
By velocity-time graph,
Acceleration $=$ slope $=t$
$5=\frac{v}{10}$
$\mathrm{V}=50 \mathrm{~m} / \mathrm{s}$
Distance=Area of $v$-t graph
$=\frac{1}{2}(30+10)(50)$
$=1000 \mathrm{ft}$
