Question:
Solve the following system of inequalities graphically: x ≥ 3, y ≥ 2
Solution:
x ≥ 3 … (1)
y ≥ 2 … (2)
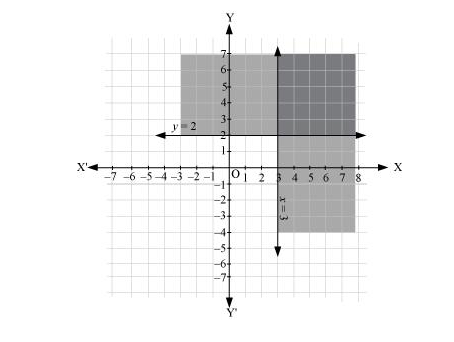
The graph of the lines, x = 3 and y = 2, are drawn in the figure below.
Inequality (1) represents the region on the right hand side of the line, x = 3 (including the line x = 3), and inequality (2) represents the region above the line, y = 2 (including the line y = 2).
Hence, the solution of the given system of linear inequalities is represented by the common shaded region including the points on the respective lines as follows.