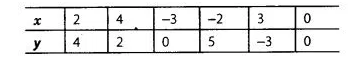
Plot the points (x, y) given by the following table.
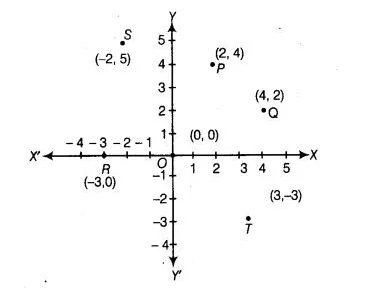
On plotting the given points on the graph, we get the points P(2,4), Q(4,2) R (-3, 0), S (-2, 5), T (3, – 3)and O (0 0)
Leave a comment
All Study Material