
Question:
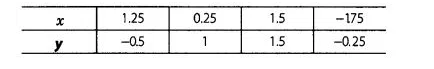
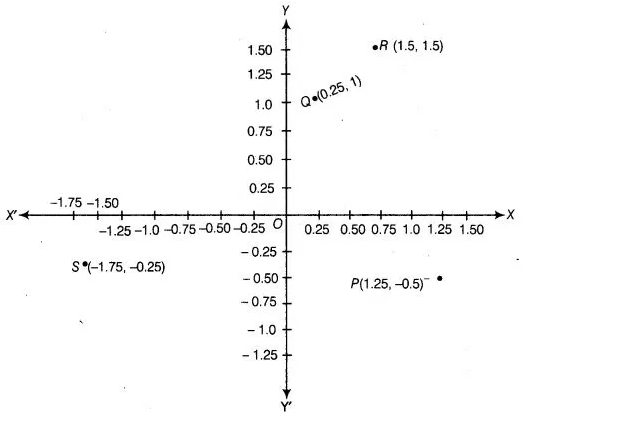
Plot the points (x, y) given by the following table. Use scale 1 cm= 0.25 unit.
Solution:
Let X’OX and X’ OX be the coordinate axes. Plot the given points (1.25, -0.5), (0.25, 1), (1.5,1.5) and (-1.75, – 0.25) on the graph paper.
Click here to get exam-ready with eSaral
For making your preparation journey smoother of JEE, NEET and Class 8 to 10, grab our app now.