Question:
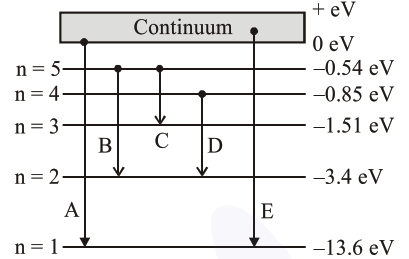
In the given figure, the energy levels of hydrogen atom have been shown along with some transitions marked $A, B, C, D$ and $E$. The transitions $\mathrm{A}, \mathrm{B}$ and $\mathrm{C}$ respectively represent :

Correct Option: , 3
Solution:
$\mathrm{A} \rightarrow$ Series limit of Lymen series.
$\mathrm{B} \rightarrow$ Third member of Balmer series.
$\mathrm{C} \rightarrow$ Second member of Paschen series.
