
Question:
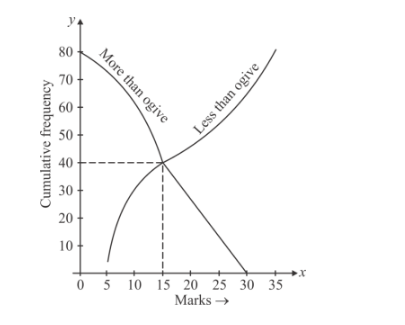
In Fig. 1, the value of the median of the data using the graph of less than ogive and more than ogive is
(a) 5
(b) 40
(c) 80
(d) 15
Solution:
Here we have to find the median from the given graph.
The following graph is given.
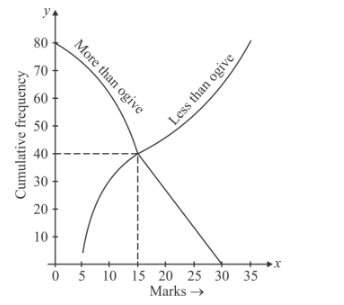
From the given graph we can easily see that the total cumulative frequency N = 80.
First we draw a line from the point $\frac{N}{2}=\frac{80}{2}=40$ on the less than ogive graph which is parallel to the $x$-axis and draw a line perpendicular to the $x$-axis from that point, which meet the $x$-axis at $x=$ 15 which is the desired median.
Hence the correct option is (d)