
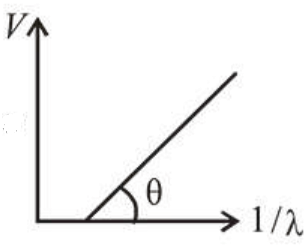
In a photoelectric effect experiment, the graph of stopping potential $V$ versus reciprocal of wavelength obtained is shown in the figure. As the intensity of incident radiation is increased :
Correct Option: , 4
(4) According to Einstein's photoelectric equation
$K_{\max }=h v-\phi_{0}$
$\Rightarrow e V_{s}=\frac{h c}{\lambda}-\phi_{0}$
$\Rightarrow V_{s}=\frac{h c}{\lambda e}-\frac{\phi_{0}}{e}$
where $\lambda=$ wavelength of incident light
$\phi_{0}=$ work function
$V_{s}=$ stopping potential
Comparing the above equation with $y=m x+c$, we get
slope $=\frac{h c}{e}$
Increasing the frequency of incident radiation has no effect on work function and frequency. So, graph will not change.
Click here to get exam-ready with eSaral
For making your preparation journey smoother of JEE, NEET and Class 8 to 10, grab our app now.