
Solution:
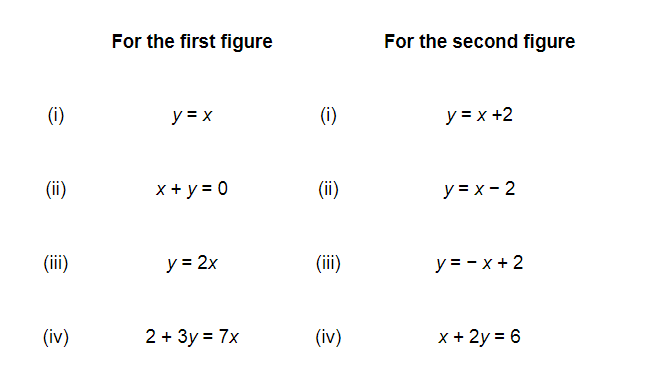
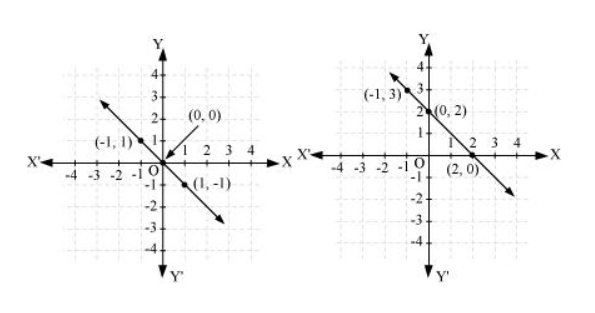
Points on the given line are $(-1,1),(0,0)$, and $(1,-1)$.
It can be observed that the coordinates of the points of the graph satisfy the equation $x+y=0 .$ Therefore, $x+y=0$ is the equation corresponding to the graph as shown in the first figure.
Hence, (ii) is the correct answer.
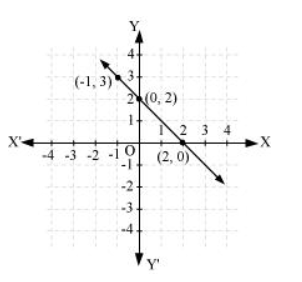
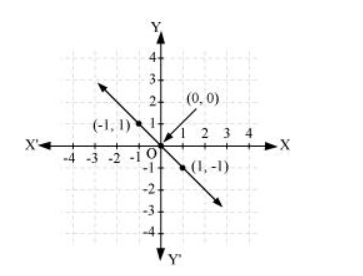
Points on the given line are $(-1,3),(0,2)$, and $(2,0)$. It can be observed that the coordinates of the points of the graph satisfy the equation $y=$ $-x+2$
Therefore, $y=-x+2$ is the equation corresponding to the graph shown in the second figure.
Hence, (iii) is the correct answer,
Click here to get exam-ready with eSaral
For making your preparation journey smoother of JEE, NEET and Class 8 to 10, grab our app now.