
Draw the graphs of linear equations y = x and y = – x on the same Cartesian plane. What do you observe? f Thinking Process
(i) Firstly find atleast two different points satisfying each linear equation.
(ii) Secondly plot these points on a graph paper and get two different lines respective after joining their points.
(iii) Further, observe the equations of lines.
The given equation is y = x. To draw the graph of this equations, we need atleast two points lying on the given line.
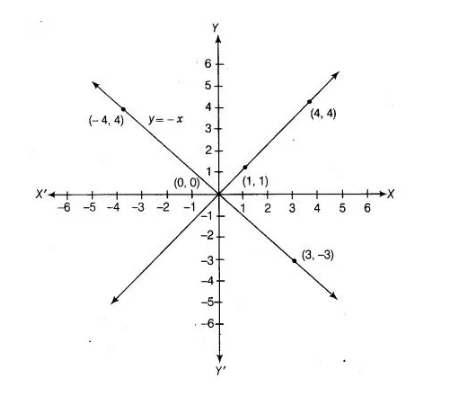
For x = 1, y = 1, therefore (1,1) satisfies the linear equation y = x.
For x = 4, y = 4, therefore (4, 4) satisfies the linear equation y = x.
By plotting the points (1,1) and (4, 4) on the graph paper and joining them by a line, we obtain the graph of y = x.
The given equation is y = – x. To draw the graph of this equation, we need atleast two points lying on the given line.
For x = 3, y = – 3, therefore, (3, – 3) satisfies the linear equation y = -x.
For x = – 4, y = 4, therefore, (- 4, 4) satisfies the linear equation y = -x.
By plotting the points (3, – 3) and (- 4, 4) on the graph paper and joining them by a line, we obtain the graph of y = – x.
We observe that, the line y = x and y = – x intersect at the point 0(0, 0).