Question:
Draw a histogram for the frequency distribution of the following data.

Solution:
The given frequency distribution is in exclusive form.
We will represent the class intervals along the x-axis & the corresponding frequencies along the y-axis.
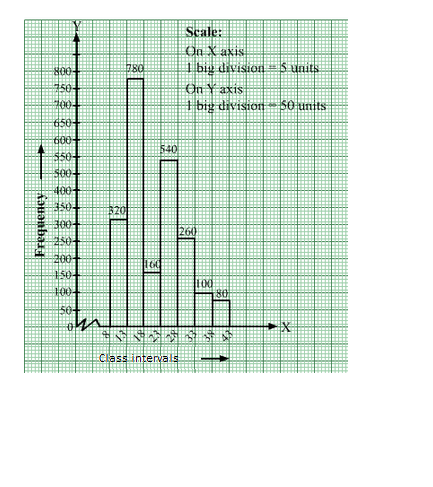
The scale is as follows:
On x-axis: 1 big division = 5 units
On y-axis: 1 big division = 50 units
Because the scale on the x-axis starts at 8, a kink, i.e., a break, is indicated near the origin to signify that the graph is drawn with a scale beginning at 8
and not at the origin.
We will construct rectangles with the class intervals as bases and the corresponding frequencies as heights.
Thus, we will obtain the following histogram: