
Question:
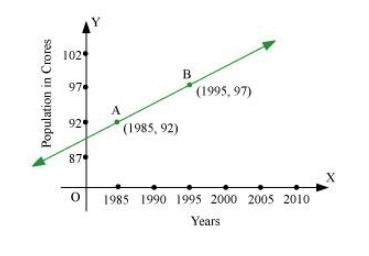
Consider the given population and year graph. Find the slope of the line AB and using it, find what will be the population in the year 2010?
Solution:
Since line AB passes through points A (1985, 92) and B (1995, 97), its slope is $\frac{97-92}{1995-1985}=\frac{5}{10}=\frac{1}{2}$
Let y be the population in the year 2010. Then, according to the given graph, line AB must pass through point C (2010, y).
$\therefore$ Slope of $A B=$ Slope of $B C$
$\Rightarrow \frac{1}{2}=\frac{y-97}{2010-1995}$
$\Rightarrow \frac{1}{2}=\frac{y-97}{15}$
$\Rightarrow \frac{15}{2}=y-97$
$\Rightarrow y-97=7.5$
$\Rightarrow y=7.5+97=104.5$
Thus, the slope of line $\mathrm{AB}$ is $\frac{1}{2}$, while in the year 2010 , the population will be $104.5$ crores.