Question:
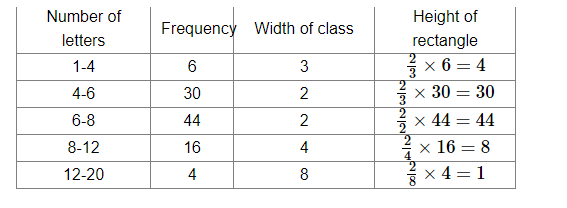
100 surnames were randomly picked up from a local telephone directory and frequency distribution of the number of letters in the English alphabet in the surnames was found as follows:

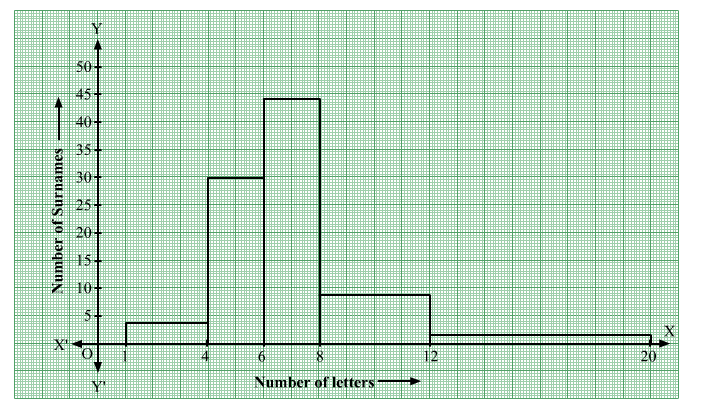
(i) Draw a histogram to depict the given information.
(ii) Write the class interval in which the maximum number of surnames lie.
Solution:
(i) Here the class intervals are of unequal size. So, we calculate the adjusted frequency using the formula,
Adjusted freq $=\frac{\min \text { class size }}{\text { class size of this class }} \times$ freq
Class sizes are
$4-1=3$
$6-4=2$
$8-6=2$
$12-8=4$
$20-12=8$
Minimum class size = 2


(ii) Maximum number of surnames lie in the interval 6-8.
